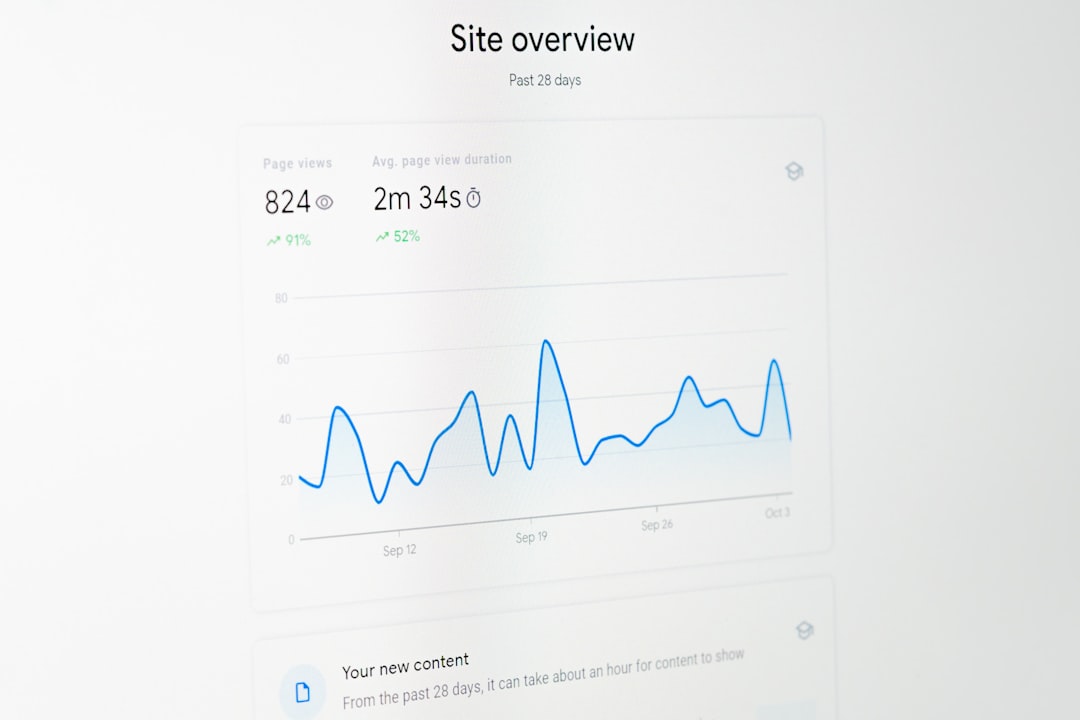
You’re digging into your website’s traffic numbers. Everything looks amazing. Suddenly, a tiny word in the corner makes your stomach drop — “This report is based on sampled data.” Uh-oh. What does that even mean? And can you trust it?
Yes, analytics sampling can lie to you. But don’t worry — we’re going to help you dodge those lies.
What is Analytics Sampling?
Imagine you want to know what your entire school thinks about pizza. Instead of asking all 1,000 students, you ask just 100. That’s a sample. It might give you a pretty good idea, but it could also be really wrong.
That’s what Google Analytics and other tools often do. When you pull a report with tons of data, they don’t crunch every single data point. They select a slice and show you results based on that.
Sounds innocent enough, right? But trouble starts when that sample doesn’t match reality.
Why Sampling Lies to You
Sampling is great when speed matters more than perfect accuracy. But in digital analytics, bad sampling can lead to very wrong ideas — ideas that could cost you time, money, or worse… embarrassment at a team meeting.
Here’s why sampling can lead you astray:
- It doesn’t represent the whole picture. If your visitors behave differently at different times, a sample might miss important trends.
- It averages things out. Spikes, dips, or unique insights get ironed out or missed completely.
- You make poor decisions based on wrong data. Sampling can show you conversion rates or user flows that don’t exist in reality!
Let’s look at how to avoid getting fooled.
Spot Sampling Before It Spots You
Good news: analytics tools warn you when sampling is happening. Keep an eye out for messages like:
- “This report is based on X% of sessions.”
- “Sampling applied to this report.”
In Google Analytics, you’ll often see a yellow shield icon with the word “Sampling” next to it. If the percentage isn’t 100%, you’re looking at a sample.

Simple Ways to Avoid Sampling
Let’s skip the stress and look at ways to get clean, unsampled data.
1. Use Shorter Date Ranges
Most tools sample data when the period is too long. Instead of looking at a full year, try looking one week at a time.
Pro tip: Download weekly reports regularly, then combine them later in a spreadsheet. Boom — full year, no sampling.
2. Use Prebuilt Reports
Standard reports in Google Analytics, like “Audience Overview” or “Acquisition > Channels,” often come unsampled.
Custom reports, filters, or segments? That’s where sampling sneaks in.
3. Use BigQuery (for GA4)
If you’ve upgraded to Google Analytics 4, congrats! You can export your raw data to BigQuery. That means
- No sampling
- Custom analysis
- Massive datasets at your control
It takes effort to set up, but if your site has big traffic, it’s worth it.
4. Upgrade to GA4 360
If you’re running a business with thousands of users daily, consider the paid version of GA4: Analytics 360. It gives you much higher sampling limits — sometimes eliminating them entirely. But it comes with an enterprise-sized price tag.

Get Better Results With Smarter Queries
The way you query your data can also make a big difference. Follow these smart practices:
1. Use Fewer Segments
Each segment added increases the pressure on the data engine — and increases the odds of sampling. Try to minimize segments and only use them when necessary.
2. Minimize Filters
Like segments, filters are tricky. Each filter increases complexity. If you must use them, apply them with care and test your results.
3. Remove Unnecessary Dimensions
Don’t go wild adding 10 different dimensions to your report. Keep it tight. More dimensions mean more calculations — and yes, more sampling.
When Sampling Is Okay
You don’t need to avoid sampling all the time. It’s fine in these situations:
- You need a quick look. Just testing a theory? Sampled data can point you in the right direction.
- Your sample size is still huge. Sometimes, even a 10% sample still includes millions of sessions. That’s probably reliable enough.
- You’re comparing trends, not exact numbers. Sampling often tells you where things are headed, even if it’s not perfectly precise.
How to Validate Sampled Data
If you must use sampled data, double-check it:
- Run the same report with a shorter date range. Does the pattern look the same?
- Download rough numbers monthly instead of yearly. Add those up. Do they match what the longer-range report said?
- Compare against other tools. Check your CRM, ads dashboard, or raw log files.
The goal: Check if your sampled data matches reality — or if it’s selling you a digital lie.
Be a Data Detective
Analytics is all about asking “Why?” and “Is this real?” Data is only as good as the way you look at it. Sampling makes things fast and light — but often fuzzy. When you want precision, sampling is your enemy.
Stay curious. Check your sources. Confirm your numbers. Know when to trust the sample — and when it’s time to get real.

In Summary: Avoiding Sampling Lies
Let’s review your sampling survival kit:
- Watch for sampling warnings
- Use shorter date ranges
- Stick with standard reports where possible
- Simplify your filters and segments
- Validate your analysis against other sources
- Use BigQuery or GA4 360 if needed
Now you’re ready to avoid analytics lies and stand tall in front of your metrics. Happy analyzing!

