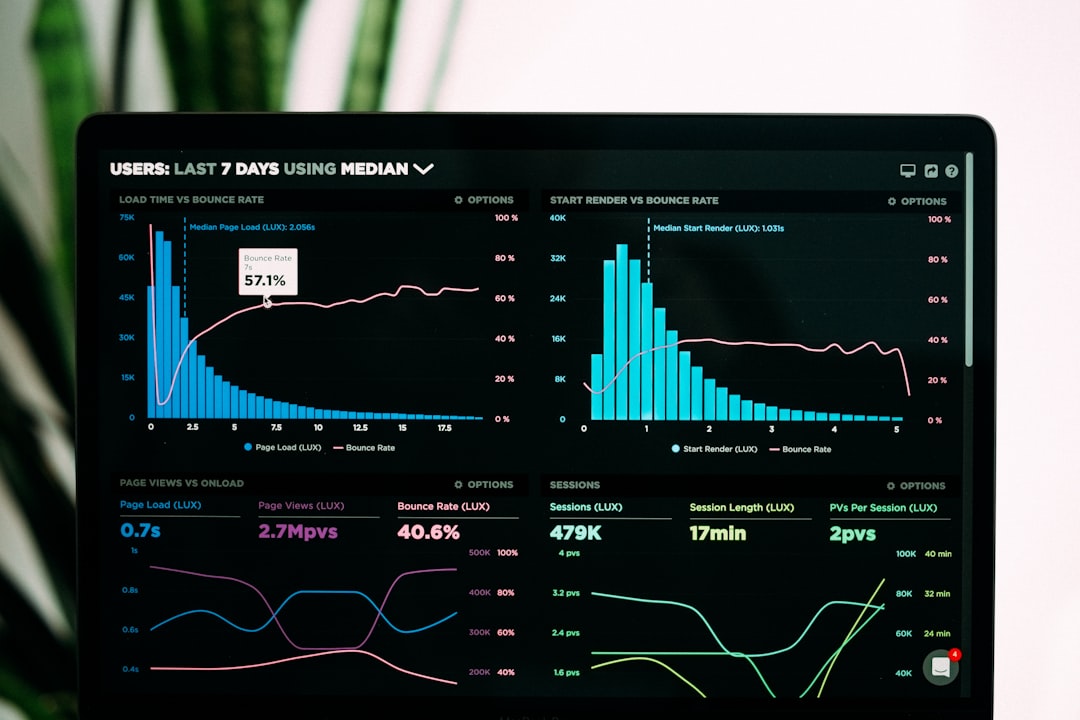
In today’s data-driven world, businesses generate more information than ever before—from customer interactions and sales figures to marketing performance and operational metrics. The challenge is no longer collecting data, but making sense of it quickly and accurately. That’s where modern data analytics platforms step in. These tools transform raw numbers into clear, interactive reports that help teams make smarter decisions, faster.
TL;DR: Data analytics platforms streamline reporting by automating data collection, visualization, and insight generation. Tools like Tableau, Power BI, Looker, Google Analytics 4, and Zoho Analytics offer powerful dashboards and real-time reporting features. Each platform excels in different areas, from deep enterprise analytics to user-friendly marketing reports. Choosing the right one depends on your business size, data complexity, and reporting goals.
Below, we explore five powerful data analytics platforms that make reporting faster and easier—along with a comparison chart to help you decide which one fits your needs.
1. Tableau
Best for: Advanced data visualization and enterprise-level analytics
Tableau has long been considered a leader in data visualization. Its strength lies in transforming complex datasets into interactive, visually appealing dashboards that even non-technical stakeholders can understand.
With Tableau, users can:
- Connect to multiple data sources, including cloud databases, spreadsheets, and big data systems
- Create drag-and-drop visualizations without heavy coding
- Build interactive dashboards that update in real time
- Share reports securely across teams and departments
Tableau’s powerful calculation engine allows for deep analysis, such as forecasting trends and creating advanced statistical models. While it may have a steeper learning curve compared to some tools, its flexibility and scalability make it ideal for medium to large enterprises.
Why it makes reporting faster: Once connected to your data sources, Tableau automates dashboard updates, eliminating the need to manually refresh reports every week or month.
2. Microsoft Power BI
Best for: Organizations already using Microsoft tools
Microsoft Power BI is one of the most widely adopted analytics platforms, partly because of its seamless integration with Excel, Azure, and other Microsoft products. For businesses already operating within the Microsoft ecosystem, implementation is smooth and cost-effective.
Key features include:
- Prebuilt templates and connectors for hundreds of data sources
- AI-powered insights that highlight trends automatically
- Customizable dashboards with real-time analytics
- Strong data security and compliance features
Power BI’s interface feels familiar to Excel users, which reduces the adoption barrier. Its built-in AI capabilities can automatically detect anomalies and patterns, cutting down hours of manual analysis.
Why it makes reporting faster: Users can schedule automatic data refreshes and distribute interactive dashboards across teams without exporting static files.
3. Looker
Best for: Data-driven organizations focused on consistent metrics
Looker, now part of Google Cloud, is a powerful business intelligence platform built for teams that need consistent definitions and centralized data governance. Instead of creating isolated reports, Looker encourages companies to build a single source of truth.

Notable capabilities include:
- Model-based approach using LookML to define metrics consistently
- Cloud-native architecture for scalability
- Embedded analytics for customer-facing applications
- Advanced access controls and data permissions
Looker excels at making sure everyone in the organization works from the same KPIs. Marketing, sales, and finance teams can all access dashboards built on unified definitions, reducing confusion and reporting discrepancies.
Why it makes reporting faster: By centralizing metric definitions, teams spend less time reconciling numbers and more time interpreting results.
4. Google Analytics 4 (GA4)
Best for: Marketing and website performance reporting
For businesses focused on online presence and user behavior, Google Analytics 4 is an essential reporting platform. It tracks website and app interactions, providing detailed insights into user journeys, traffic sources, and conversions.
Key advantages include:
- Event-based tracking for flexible data collection
- Cross-platform measurement (web and mobile apps)
- Built-in machine learning insights
- Customizable reports and dashboards
GA4 is especially valuable for marketing teams that need to measure campaign performance quickly. Integrated with Google Ads and other marketing tools, it provides near real-time data on traffic and conversions.
Why it makes reporting faster: Automated insights and standard marketing templates reduce the effort needed to generate campaign performance reports.
5. Zoho Analytics
Best for: Small to mid-sized businesses seeking affordability and ease of use
Zoho Analytics is a user-friendly platform that provides robust reporting without the complexity or price tag of larger enterprise tools. It integrates seamlessly with other Zoho applications, as well as third-party tools like CRM systems, accounting software, and social media platforms.

Standout features include:
- Self-service analytics with an intuitive interface
- AI assistant for asking data questions in natural language
- Prebuilt dashboards for sales, marketing, and finance
- Automated data syncing and scheduled report delivery
Zoho Analytics is ideal for companies that want actionable insights without hiring a full analytics team. Its AI-powered assistant can generate reports simply by answering questions typed in plain English.
Why it makes reporting faster: Prebuilt dashboards and automated email reports eliminate repetitive manual tasks.
Comparison Chart
| Platform | Best For | Ease of Use | Customization Level | Pricing Tier |
|---|---|---|---|---|
| Tableau | Enterprise visualization | Moderate to Advanced | Very High | Premium |
| Microsoft Power BI | Microsoft-based organizations | Moderate | High | Affordable to Mid-range |
| Looker | Data governance and scalability | Advanced | Very High | Enterprise |
| Google Analytics 4 | Marketing analytics | Beginner to Moderate | Medium | Free to Premium |
| Zoho Analytics | Small and mid-sized businesses | Beginner Friendly | High | Budget Friendly |
How to Choose the Right Platform
Selecting the right data analytics tool depends on several factors:
- Data complexity: Enterprises handling massive data sets may prefer Tableau or Looker.
- Budget: Small businesses might lean toward Zoho Analytics or GA4.
- Integration needs: If you rely heavily on Microsoft products, Power BI is a logical choice.
- Reporting goals: For marketing-centric reporting, GA4 provides specialized insights.
You should also consider scalability. As your organization grows, your reporting requirements will likely become more complex. Choosing a tool that can evolve alongside your needs prevents costly platform migrations later.
Final Thoughts
Data analytics platforms are no longer optional—they are central to modern business strategy. The right tool not only saves time but empowers teams with accessible, accurate, and actionable insights. Whether you need enterprise-grade dashboards, marketing-specific reports, or simple small-business analytics, there is a platform tailored to your workflow.
By automating data collection, enabling real-time updates, and delivering visually engaging reports, these five platforms dramatically reduce the effort required to turn raw data into strategic decisions. When reporting becomes faster and easier, organizations can focus less on compiling numbers—and more on driving growth.